Reading Graphs and Charts: The Data Skill Schools Rush Through
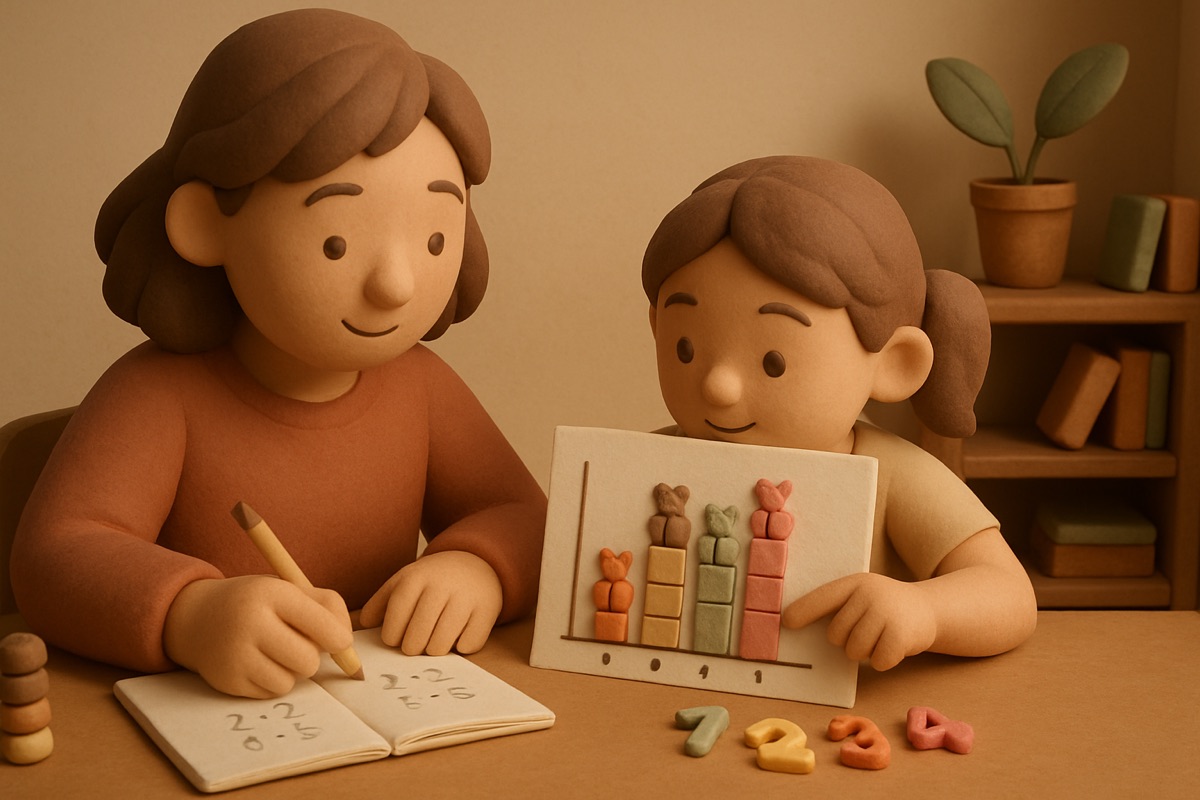
One March a third grader named Priya raised her hand during a lesson on bar graphs and asked, "But what does the tall one mean?" She could read the numbers off the side. She could tell me the blue bar reached 8. She just had no idea that the tall bar meant "more of something." That question has stuck with me for years, because it exposes the gap I see every spring when we teach kids to read graphs in one hurried unit and then move on.
Data and graphing usually get about a week of class time per grade. One week. Then it disappears until the next year, when we do another week. Meanwhile these same charts show up on every standardized test, in science, and eventually in every news article your kid will ever read. So the skill matters far more than the tiny slice of attention it gets.
Why the rush happens
Elementary math is crowded. Teachers are juggling place value, fractions, multiplication facts, measurement, and a dozen other things, and the pacing guide gives graphing a small corner. It's not that anyone thinks it's unimportant. It's that something has to give, and a topic that feels "easy" is the first to get squeezed.
The trouble is that reading a graph is not one skill. It's a stack of them:
- Knowing what the axes stand for
- Understanding that height, length, or size means quantity
- Comparing two values without reading the exact numbers
- Noticing a trend (going up, going down, staying flat)
- Deciding whether the graph even answers your question
We tend to teach the first item and quietly assume the rest come along for the ride. They don't. Priya proved that. She had step one and was missing step two entirely.
Start with real questions, not blank grids
The worst way to teach graphing is to hand a kid a blank grid and a table of made-up numbers. There's no reason to care about the answer. Data only makes sense when it answers something a person actually wondered about.
So at home, start with a question your kid has. How many rainy days did we get this month? Which snack does everyone in the house like best? How many cars are red versus every other color on a five-minute walk? The question comes first, then the counting, then the picture.
Here's one my own class loved. We tracked how many minutes each morning it took the bus to arrive. Some days two minutes, some days nine. After two weeks we had a jagged little line graph, and suddenly a kid said, "Mondays are always slow." He'd read a trend off a graph without me ever using the word trend. That's the goal.
Household objects beat printed worksheets
You don't need special materials. A bag of dried beans, a stack of coins, and a piece of paper will do more than a packet of graph pages.
Try this. Grab a jar of loose change and sort it into piles by coin. Line the piles up. Now you have a physical bar graph, and you can ask the good questions. Which pile is tallest? If you traded all the pennies for the same height of quarters, would you have more money or less? That last one is sneaky, because the tallest pile (pennies) is worth the least. Kids who only look at "which bar is biggest" get fooled, and that's exactly the kind of thinking a good chart reader needs to catch.
Cereal boxes work too. The little nutrition panel is a data table. Ask which cereal has more sugar per serving. You've just done comparison reading with numbers that mean something at breakfast.
Teach them to be a little skeptical
The most valuable graph skill isn't reading the numbers. It's asking whether the picture is fair. This sounds advanced for a nine year old, but they get it faster than you'd think.
Draw a bar graph where the bottom of the scale starts at 90 instead of 0, so two bars that are really 92 and 96 look wildly different. Show it to your kid. Ask, "Does this look like a big difference or a small one?" Then show the same data starting at 0. The bars barely differ. A kid who has seen this trick once will spot it for the rest of their life, and it's the same trick used in plenty of charts they'll meet as adults.
You can do the pie chart version too. If someone leaves a slice off, or the slices don't add up to the whole, something's wrong. Missing pieces and stretched scales are the two things I'd want every kid to hunt for.
Keep it small and frequent
Because schools give this topic so little room, the fix at home is not a big project. It's frequency. A two minute question at dinner. A quick sketch of how many books everyone read this week. A glance at the weather app and a question about which day was warmest. Little reps, spread across the year, beat one intense week.
I built some of this thinking into Math Prizes because I kept seeing the same freeze that Priya had, but honestly you don't need an app for graphs. You need a jar of coins, a real question, and the patience to let your kid discover that the tall bar means more. Once that clicks, the rest of teaching kids to read graphs gets a lot easier.
The next time your child brings home a chart, resist the urge to point at the answer. Ask them what they notice first. Then ask what the picture might be hiding. Those two habits will carry them further than any worksheet ever could.